CLIMATE: RANGPUR
Rangpur's
climate is classified as warm and temperate. The summers are much rainier than
the winters in Rangpur. According to Köppen and Geiger, this climate is
classified as Cwa. The average temperature in Rangpur is 24.9 °C. The average
annual rainfall is 2192 mm.
RANGPUR - It is highly difficult, if not
impossible, to forecast what the weather will be like at a certain time in a
very precise place.
And yet, all
travellers would like to know in advance the climate conditions in order to
organize their future trip.
Average
temperatures or rainfall can help you to get a good idea of the issue.
The
temperatures mentioned hereafter are expressed in degrees Celsius and represent
the monthly averages observed over a great number of years.
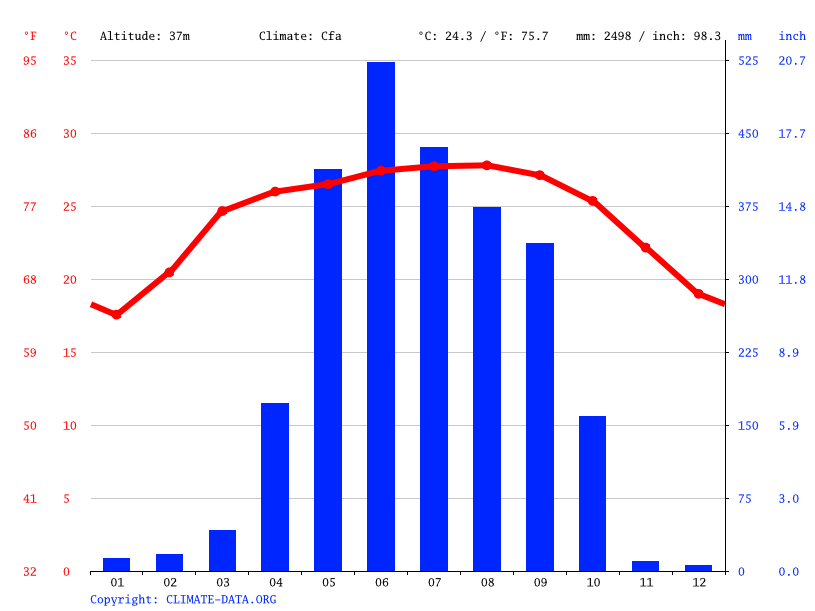
The least
amount of rainfall occurs in December. The average in this month is 3 mm. The
greatest amount of precipitation occurs in June, with an average of 481 mm.
TEMPERATURE
GRAPH
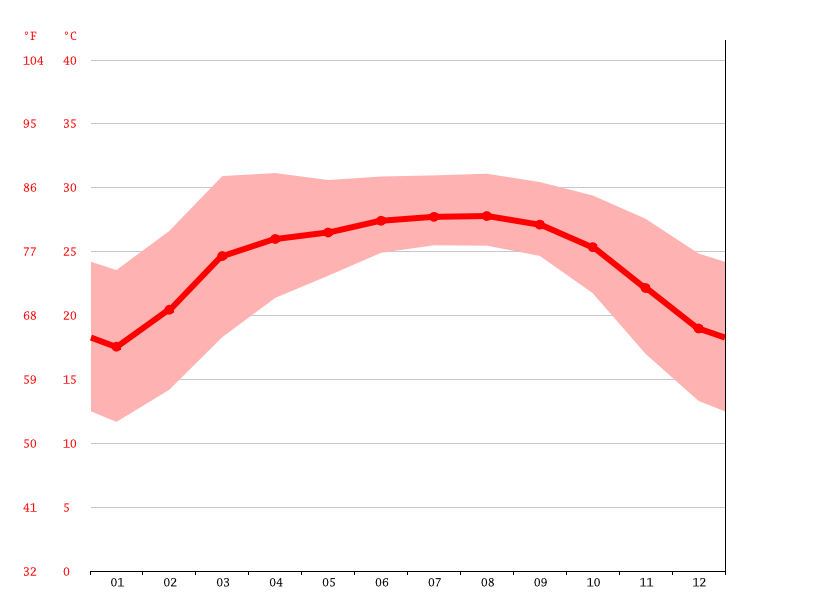
The
temperatures are highest on average in August, at around 29.0 °C. The lowest
average temperatures in the year occur in January, when it is around 17.3 °C.

The
variation in the precipitation between the driest and wettest months is 478 mm.
The variation in temperatures throughout the year is 11.7 °C.
No comments:
Post a Comment